α-Ketoglutarate Assay Kit-Fluorometric

α-Ketoglutaric Acid Measurement
- Data dispersion in an existing product has been improved.
- The α-Ketoglutarate Assay Kit-Fluorometric with high reproducibility is reliable even for a first-time user.
-
Product codeK261 α-Ketoglutarate Assay Kit-Fluorometric
| Unit size | -- | |
|---|---|---|
| 100 tests | Please inquire distributors about price. | |
| 100 tests | ・Fluorescent Dye ・α-KG Standard ・Enzyme Mix ・Coenzyme ・Assay Buffer ・lysis Solution ・Control Buffer ・ALT Solution ・Reaction Buffer |
×1 300 µl×1 ×1 ×1 6.5 ml×1 2 ml×1 25 ml×1 35 µl×1 5 ml×1 |
|---|
Description
α-Ketoglutarate (α-KG) is an important intermediate of the TCA cycle. It is used as an indicator of enhanced uptake of glucose metabolites into the TCA cycle and of enhanced glutaminolysis, the metabolic pathway for supplying α-ketoglutarate using glutamine as a substrate. α-Ketoglutarate plays an essential role in the production of glutamate and γ-aminobutyric acid (GABA) and contributes to the scavenging of reactive oxygen species. Additionally, a recent cancer study suggested that α-ketoglutarate behaves effectively for tumor suppression through the p53 protein1.


Manual
Technical info
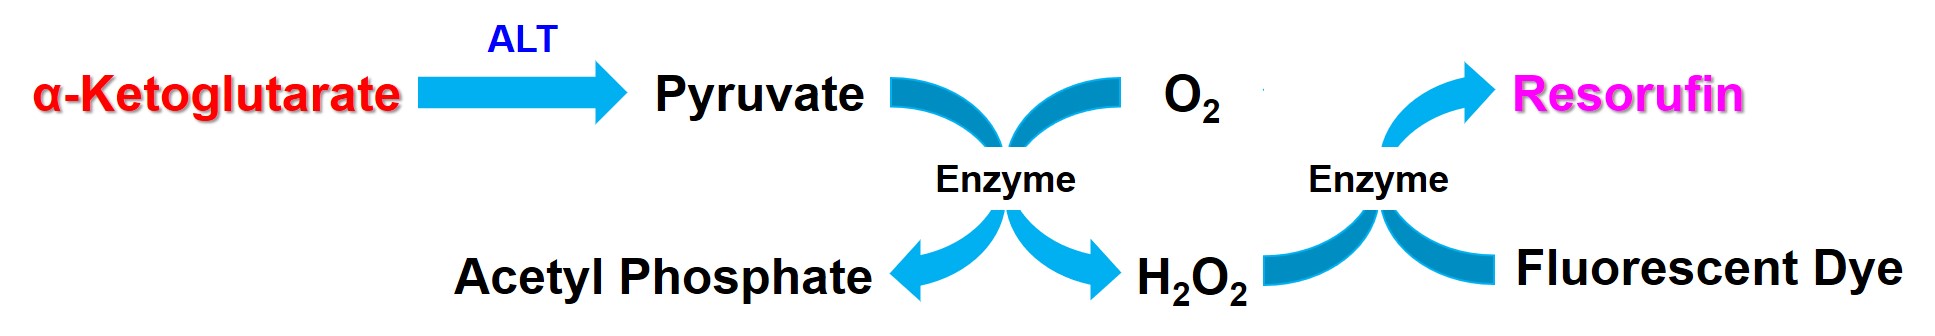
α-Ketoglutarate Assay Kit-Fluorometric enables the quantitation of α-ketoglutarate. This kit is optimized to quantify intracellular α-ketoglutarate by measuring the resorufin fluorescence generated by an enzymatic reaction (Ex:530 - 560 nm、Em:580 - 600 nm). This kit is formatted for 96-well microplates, and it is possible to measure multiple samples.
Protocol
In the process from pretreatment of cultured cells to measurement using a plate reader, α-Ketoglutarate (α-KG) concentrations can be measured using the simple method required to add the reagent. The reproducibility of data, which is a common complaint from many customers who have used an existing product, was improved, and customers with no experience measuring α-KG concentrations can comfortably use this kit.
The two reasons that improve measurement reproducibility
1.Sample pretreatment
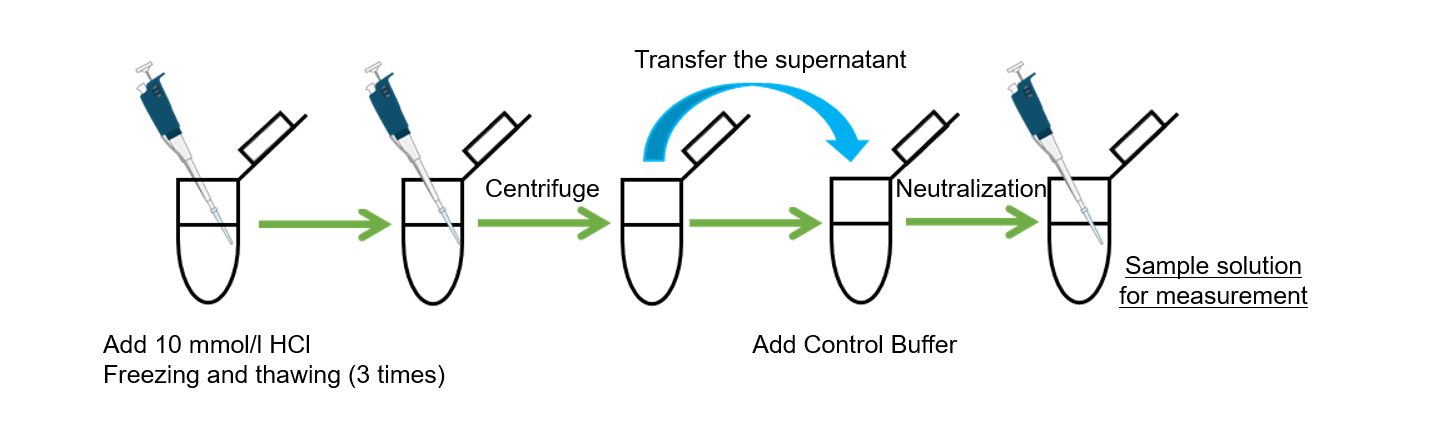
In an existing product, pretreatment required cumbersome techniques, such as pH adjustment and filtration of a microscopic quantity, and this technical complexity contributed to data dispersion. On the other hand, using the simple method required to add the reagent, the α-Ketoglutarate Assay Kit-Fluorometric improves data dispersion caused during a pretreatment process.
2.Measurement of α-Ketoglutarate
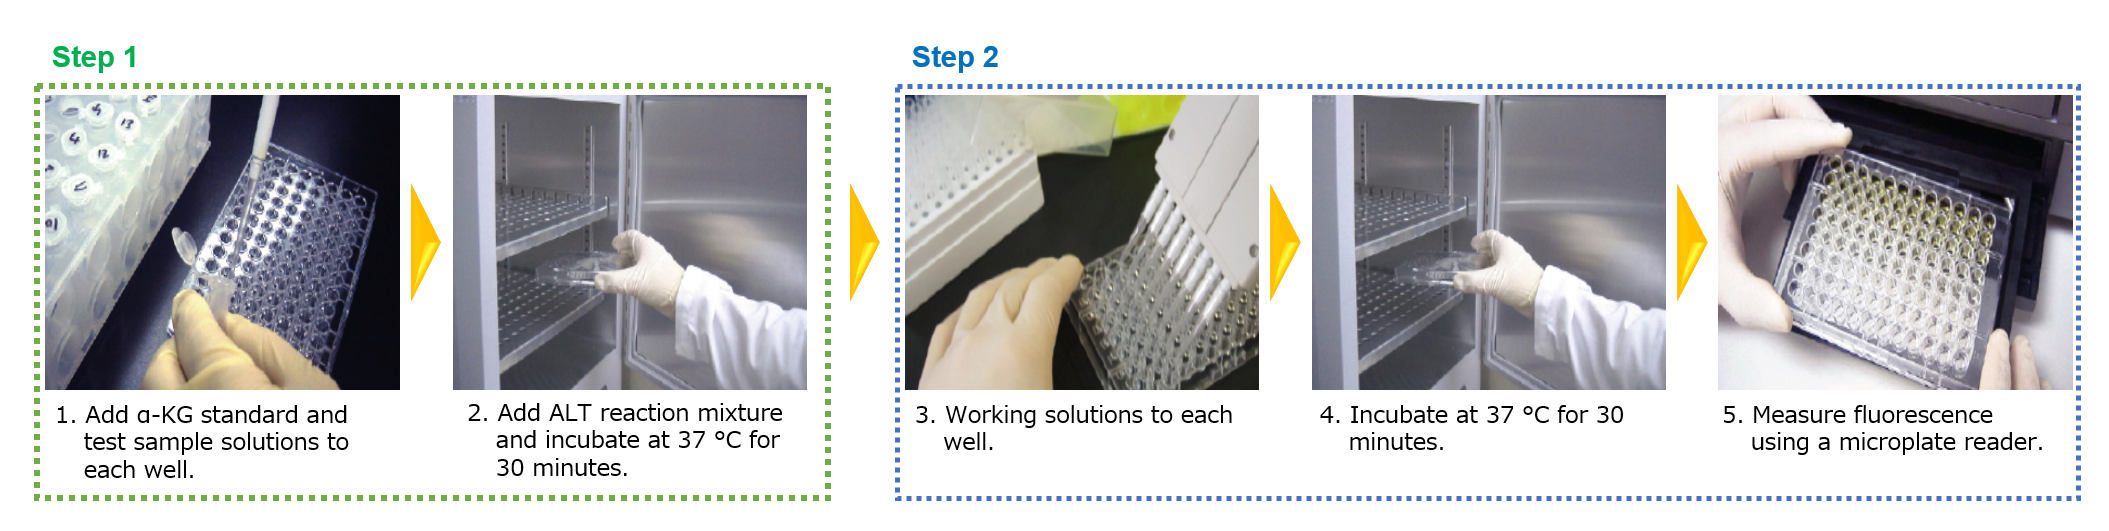
As with this kit, a plate assay for determining α-KG concentrations often uses the principle of measuring the amount of dye formed in the above reactions 1 and 2. In an existing product, data dispersion occurred when the two-step reaction proceeded simultaneously. However, the α-Ketoglutarate Assay Kit-Fluorometric uses the protocol that completes the two-step reaction, which successfully improved data dispersion arising from the chromogenic reaction.
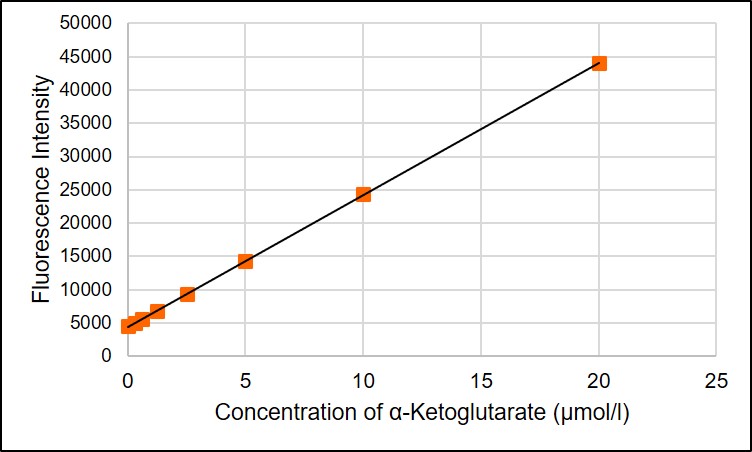
Preparation of Calibration Curve
α-Ketoglutarate levels in a sample can be measured by a calibration curve established with α-Ketoglutarate Standards included in this kit. If the α-Ketoglutarate levels are greater than or equal to 20 µmol/l, the sample must be diluted before measurement.
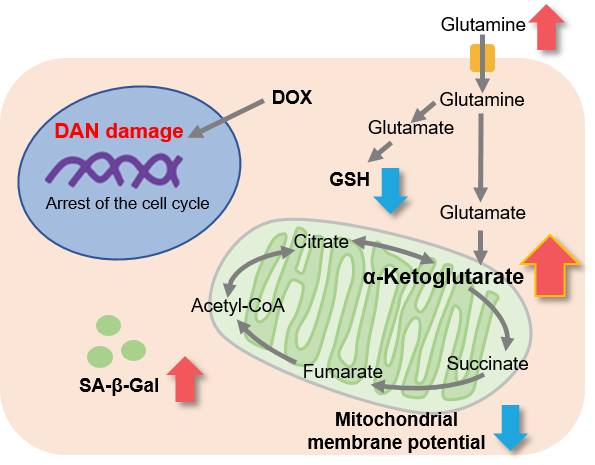
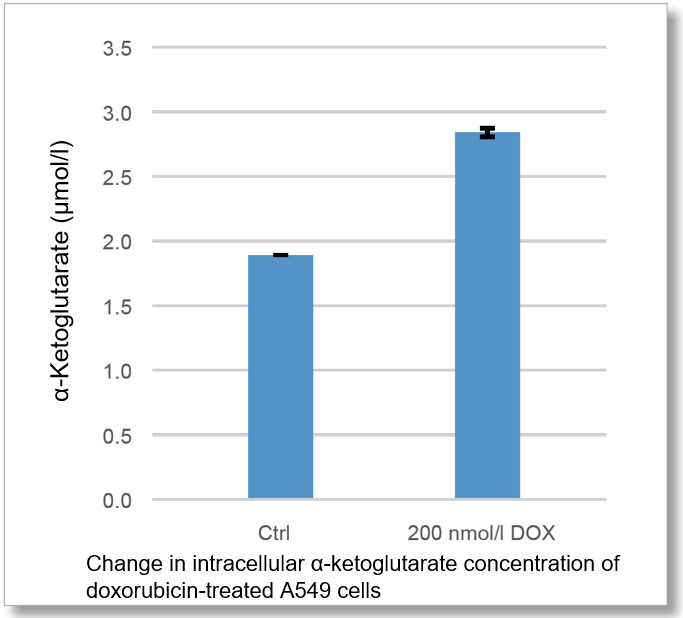
Change in intracellular metabolism of doxorubicin-treated A549 cells
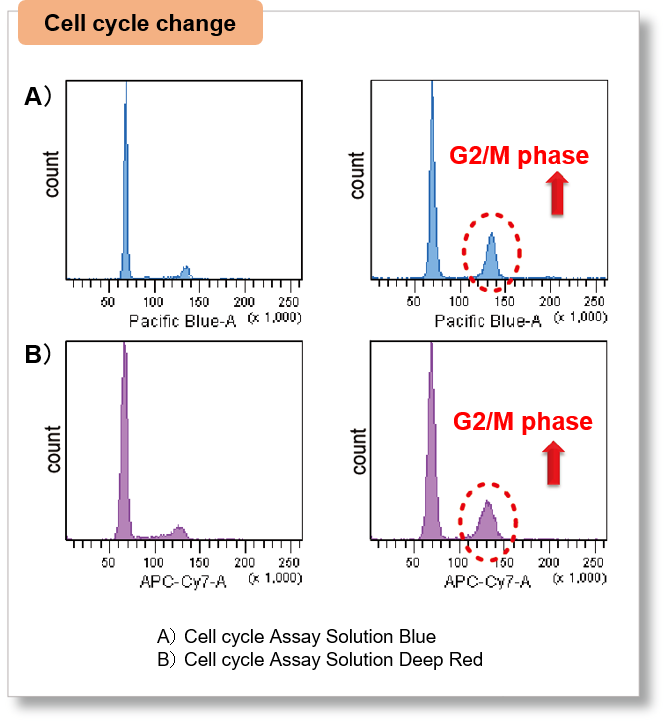
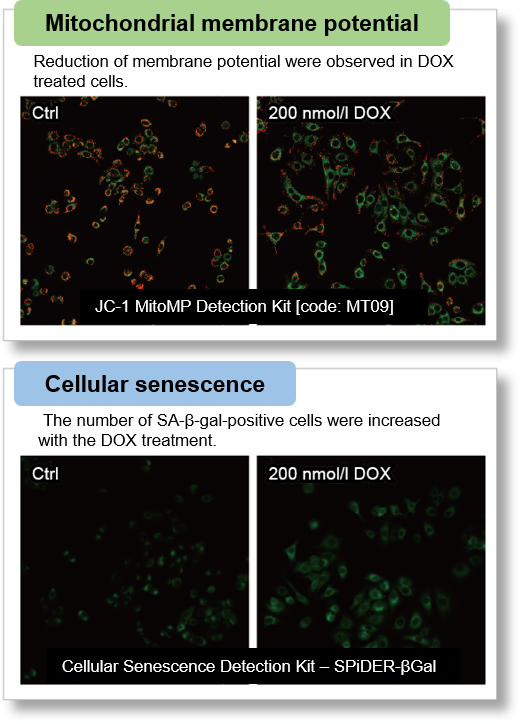
Doxorubicin (DOX), which inhibits cell proliferation by acting on the G2/M phase of the cell cycle, is known to induce cellular senescence. A549 cells treated with DOX were compared to the control cells. As a result, intracellular α-KG concentrations increased in DOX-treated A549 cells. Additionally, the Cellular Senescence Detection Kit-SPiDER-β Gal was used to detect cellular senescence, and the Cell Cycle Assay Solution Blue [code:C549]/Deep Red [code:C548] and the JC-1 MitoMP Detection Kit [code:MT09] were used to confirm changes during the cell cycle and changes in mitochondrial membrane potential, respectively.
Experimental Example: Change in Metabolism in Liver Tissue of NASH-Induced Mouse
It is known that non-alcoholic steatohepatitis (NASH) results in decreased ATP, α-ketoglutarate (α-KG), and NAD levels in affected tissues. ATP, α-KG, and NAD levels were measured in the liver tissue of type 1 diabetic model mice (STAM model) that were treated with a high-fat diet (NASH induction) since 4 weeks old. Measurement at 10 weeks old confirmed that ATP, α-KG, and NAD levels indeed decreased in the tissue samples after NASH induction.

Note: for more details about the experimental procedure, please refer to Q&A "Are there any examples of experiments using tissue samples?"
・Cellular ATP :ATP Assay Kit-Luminescence (Code:A550).
・Cellular α-KG:α-Ketoglutarate Assay Kit-Fluorometric (Code:K261).
・Cellular NAD :NAD/NADH Assay Kit-WST (Code:N509).
References:
| ATP | Francesco Bellanti, et al., "Synergistic interaction of fatty acids and oxysterols impairs mitochondrial function and limits liver adaptation during nafld progression", Redox Biology, 2018, 15, 86-96. |
|---|---|
| α-KG | Jianjian Zhao, et al., "The mechanism and role of intracellular α-ketoglutarate reduction in hepatic stellate cell activation", Bioscience Reports, 2020, 40, (3). |
| Ali Canbay, et al., "L‑Ornithine L‑Aspartate (LOLA) as a Novel Approach for Therapy of Non‑alcoholic Fatty Liver Disease", Drugs, 2019, 79, 39-44. | |
| NAD | Jinhan He, et al., "Activation of the Aryl Hydrocarbon Receptor Sensitizes Mice to Nonalcoholic Steatohepatitis by Deactivating Mitochondrial Sirtuin Deacetylase Sirt3", Mol. and Cell. Biol., 2013, 33, (10), 2047-55. |
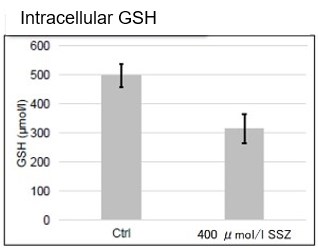
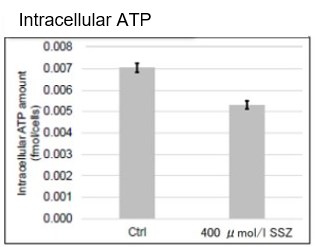
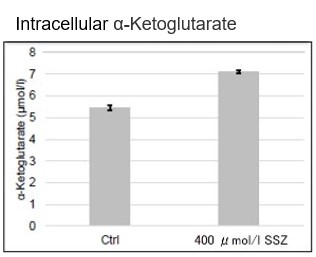
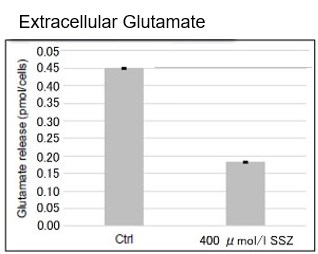
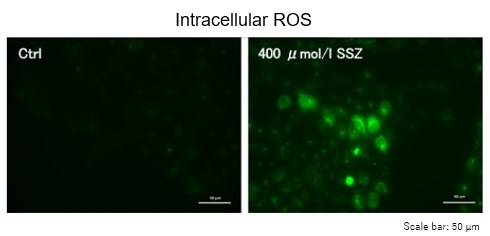
Sulfasalazine Alters Intracellular Metabolites and Increases ROS in A549 Cells
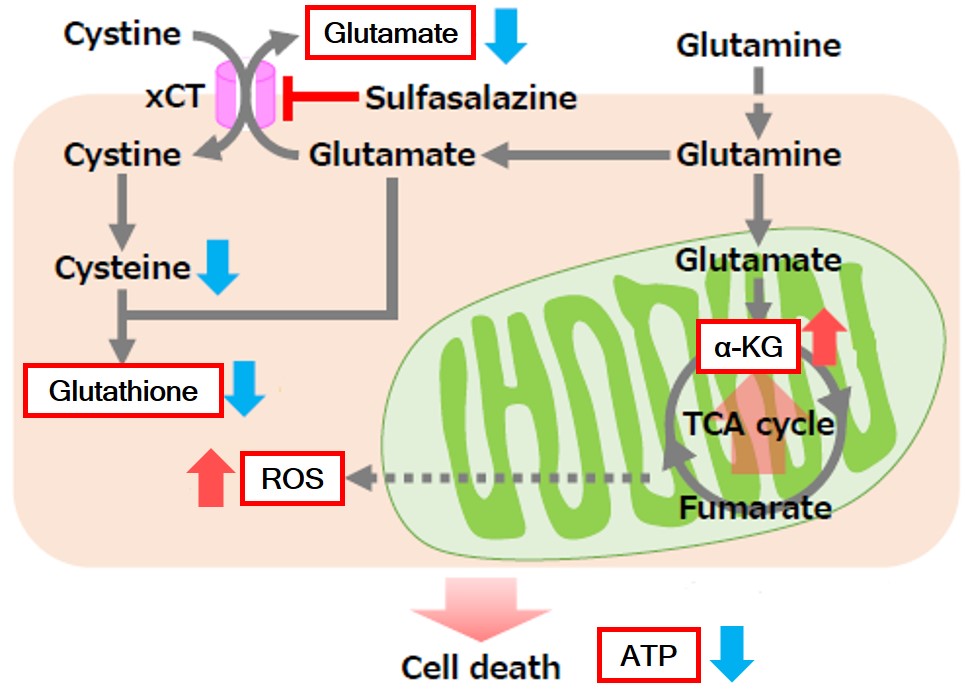 |
After addition of sulfasalazine (SSZ), a known inhibitor of cystine/glutamate transporter (xCT), to A549 cells, we observed changes in intracellular glutathione (GSH), ATP, α-ketoglutarate (α-KG), ROS and glutamate release. The results indicated that the addition of SSZ
|
     |
|
Q & A
-
Q
How many samples can I measure?
-
A
The number of samples that can be recorded when the standard curve and sample are measured in triplicates. (100 tests/kit: 12 samples) Please refer to the instruction manual for a 96-well plate layout.
-
Q
May I use color plates other than black plates for measurement?
-
A
You may not measure an accurate α-Ketoglutarate level if you use white or transparent plates; therefore, it is strongly recommended to use black plates.
-
Q
Our samples did not change in color, are there any reasons for this?
-
A
α-Ketoglutarate level contained in the sample may be lower than the detection limit (0.2 µmol/l) that can be measured using this kit. If you dilute the sample, the α-Ketoglutarate level contained in the diluted sample may be lower than 0.2 µmol/l. Please lower the dilution ratio and adjust the concentration of the sample over the detection limit that was measured using this kit.
-
Q
Can I store the working solution?
-
A
No, you cannot store the working solution. Please prepare this solution when you use it, as this solution becomes unstable when exposed to light. Please keep it in the dark after the preparation of the working solution. After the preparation, the working solution is stable in the dark at room temperature for approximately 2 hours.
-
Q
Are there any examples of experiments using tissue samples?
-
A
A. Yes. We have examples using mouse liver tissue.
General protocol is as below.
Extraction of α-KG from liver samples via alkaline extraction method
1)Add cold 0.5 mol/l KOH solution to mouse liver (500 µl /100 mg).
*Make sure blood is properly removed from the tissue sample, using hemoperfusion or other methods.
*Any residual blood may affect the measurement.
2) Homogenize the tissue with Dounce tissue grinder.
3) Collect the sample and transfer it to a sample tube.
Wash the tissue grinder with 500 µl of cold 0.5 mol/l KOH solution and transfer the solution into the sample tube. (Total volume: 1 ml)
4) Add 1 ml of cold ultrapure water to the sample tube, mix well, and put it on ice for 5 minutes. (Total volume: 2 ml)
*If the solution is highly viscous, it may be difficult to separate after centrifugation in the next step.
In this case, attach a needle (about 25 g) to a syringe and use the syringe to pipette the sample solution about 20-30 times until the
sample solution can be smoothly pipetted within the syringe.
5) Centrifuge at 12,000 x g , 4 °C for 5 minutes and collect each 900 µl of the supernatant in two new tubes.
Preparation of sample for α-KG measurement
6) Add 200 µl of 1 mol/l KH2PO4 solution to 900 µl of the sample prepared in step 5. Mix well and put it on ice for 5 minutes.
7) Centrifuge at 12,000 x g for 5 minutes at 4°C and collect 1 ml of the supernatant in a tube as a sample for measurement.
*The extracted tissue samples cannot be stored. Please measure the sample within a day of the extraction.
*For dilution of the “standard” and “sample”, use a mixture of 0.5 mol/l KOH solution and 1 mol/l KH2PO4 solution at a ratio of 9:5 as the dilution solution.
α-KG Level Changes in the Liver Tissue of NASH-Induced Mice

Handling and storage condition
| 0-5℃, Protect from moisture | |
|
Danger / harmful symbol mark |

|
|---|---|
Related products
The following related products are also used in research related to this product.