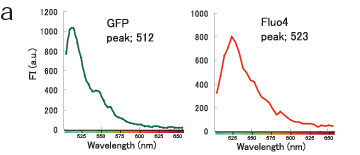
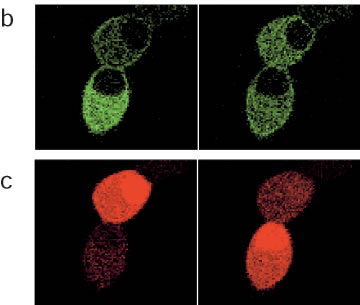
Fig.8
Unmixing of Fluo 4 and GFP by spectral confocal microscopy for simultaneous imaging of Ca and PKC signal. a, Spectral curves of PKC-GFP (left) and Fluo4 (right). b-c, dynamic changes in the signal intensities of PKC (green) and Ca (red).