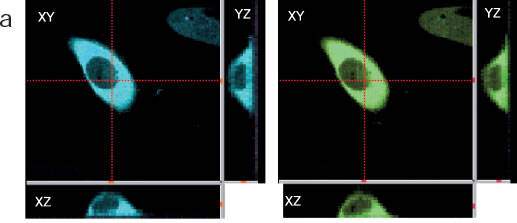
| Fig.5 5-dimentional analysis of Ca-dependent fluorescence signals by spectral confocal microscopy. a, 3D images (XY, XZ and YZ) of Yellow Cameleon 3.6 (YC
3.6)-expressed HeLa cell before and after stimulation. b, spectral changes in YC3.6 fluorescence upon Ca-dependent FRET between CFP and YFP. Data was courtesy from Cell Imaging Press, Nikon. |

