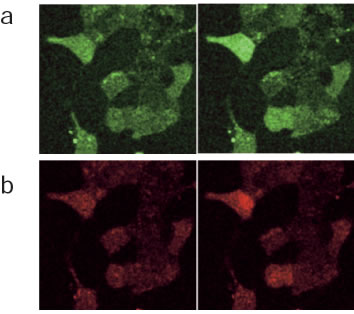
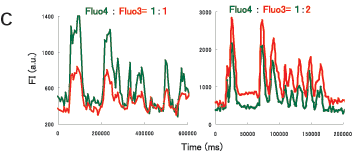
| Fig.3 Dynamic ranges of fluorescence signals in INS-1 cells stained with Fluo 4 and Fluo 3. a-b, simultaneous imaging of Fluo 4 (green) and Fluo 3 (red). c, Ca transients in cells stained with different doses (as shown in each graph) of dyes. Data were obtained at 14 th Medical Photonics Course Hamamatsu, 2005. |

