
|
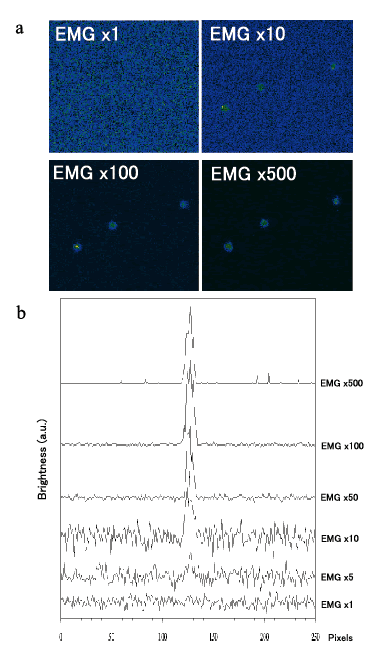
Fig. 6 Effect of the electron-multiplying gain (EMG) on S/N ratio. a, frames of fluorobead, showing images corresponding to variety of increasing EMG (x1, x10, x100, x500). b, intensity profiles through the bottom spot are shown for better visualization of S/N ratio. Courtecy from Andor technology. |