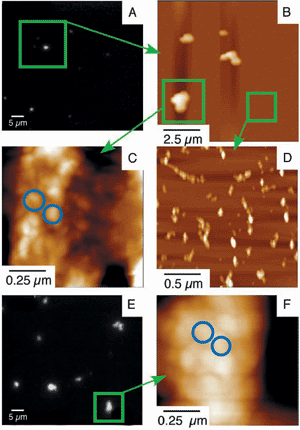

Fig. 6 Fluorescence and AFM images of DNA-complexes of KG6 at C/A ratio of 4.0. Panels A and E are fluorescence images of the complexes after 15 min and 2 h incubation, respectively. Panel B is the AFM image of the area indicated by a green square in Panel A. Panel C is a magnified image of the surface of the large complex (> 1 ƒÊm) indicated by a green square in Panel B. Panel D is a magnified image of the small complexes (< 1 ƒÊm) on the mica surface indicated by a green square in Panel B. Panel F is the magnified AFM image of the surface of the large complex indicated by a green square in Panel E. |