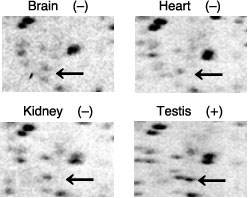
Fig.3 Parts of FRGP profiles surrounding Spot QTEH56 in four different tissues. The arrows indicate Spot QTEH56. (-) and (+) represent disappearance and appearance of Spot QTEH56, respectively.