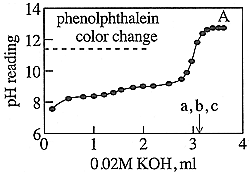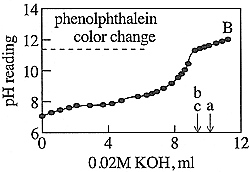


Fig.9
Potentiometric titration curves for free fatty acids in (A) camellia oil, (B) saury oil. Arrow a indicates the end-poing by phenolphthalein color change. Arrow b indicates the potentiometric end-point break. Arrow c show the volume of 0.02 M KOH corresponding to the acid value determined by FIA.